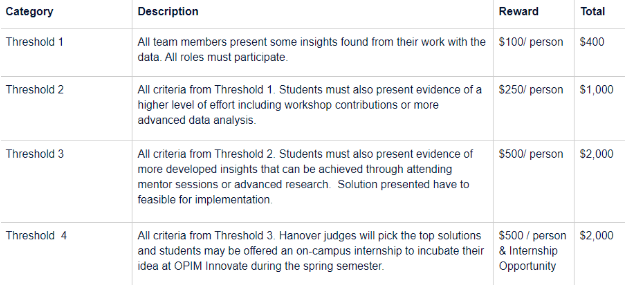
 On Wednesday, November 20th, OPIM Innovate hosted the Hanover Image Analytics Challenge in partnership with Hanover Insurance Group. There, ten teams competed for the opportunity to implement their solutions in a real-world business setting through a spring semester externship. Cash prizes were split between four different thresholds, each having their own requirements. While the lowest threshold provided each participant with a baseline of $100, the highest threshold awarded each team member with $500 and an opportunity to work with Hanover. The objective of the challenge was to have participants make use of a dataset including details on current customer properties and prospective properties to be insured by Hanover.
 The difference between this challenge and other case competitions is that it implored students to search for interdisciplinary team members. Rather than having all participants be business majors or intra-major, there were a multitude of participants with little to no business or technical knowledge. As explained by Rob Brewer, Middle Market Vice President and Chief Underwriting Officer at Hanover, the required roles self-assigned by each team member–business analyst, marketing specialist, developer, and data analyst–reflected Hanover’s real-world teams. “Our employees seldom work by themselves,” Brewer said. “They’re always working together across roles.”
Through the Hanover Challenge, students learned the benefits of cross-boundary teaming. Competitors from OP I AM, one of the Threshold 3 teams recognized during the Awards Dinner following the challenge, made this clear during the Q&A portion of their presentation. When asked what was most challenging while working through their solution, which included the use of data science methodologies to detect and assess certain property holdings, Mariela Kridzelis (MIS & English ‘19), the team’s marketing specialist, commented on the benefits of an interdisciplinary team. “I wouldn’t necessarily go down the challenge route,” she said. “I thought working with my team members was extremely enlightening. We all learned something from each other.”
 Vaughn Nangle, the data analyst of another Tier 3 group entitled Alpha Analytics, also commented on team dynamics. “Throughout the Challenge, my team members and I collaborated so well that we thought we were working beyond our roles. By the very end of the Challenge when we finally presented our solution, that’s when we realized we were actually performing our roles the entire time. In working together, we shared skillsets and expanded each other’s knowledge–it just goes to show how beneficial teams like these are.” The solution Alpha Analytics presented to the judges was a variable heat map of various insurance risk factors.
We’d like to extend a warm thank you to the Hanover Insurance Group and all faculty and staff that helped with the Hanover Image Analytics Challenge. We’d also like to thank the ten remaining teams of the Image Analytics Challenge for presenting their amazing solutions!
Please scroll through the slide deck below for team photos.
 Raised in small-town East Granby, CT,
 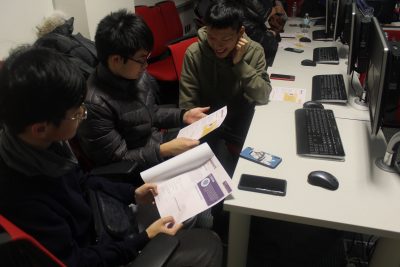 On Thursday, November 14th, OPIM Innovate hosted a Design Thinking workshop in partnership with the UConn American English Language Institute (UCAELI). During this workshop, students participating in the College Preparatory Experience program learned the first three steps of design thinking: define, empathize, and ideate. These steps implore students to define business objectives, understand the needs of their audience, and brainstorm potential ideas for a business solution. Tara Watrous, Innovate’s project coordinator, assisted students throughout the design thinking process by providing an overview of each step. She then provided the following prompt for students to answer in groups: “How can technology be utilized to enhance learning English as a second language?”
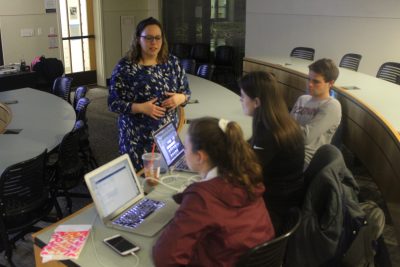 On Thursday, November 7th, Hanover Insurance and OPIM Innovate co-sponsored a Data Visualization workshop. Run by
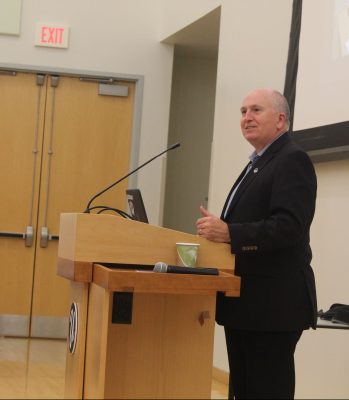
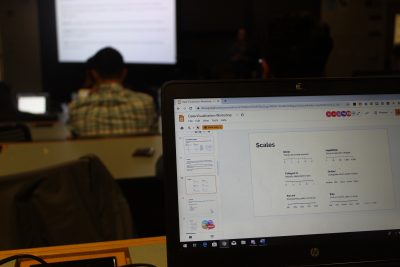
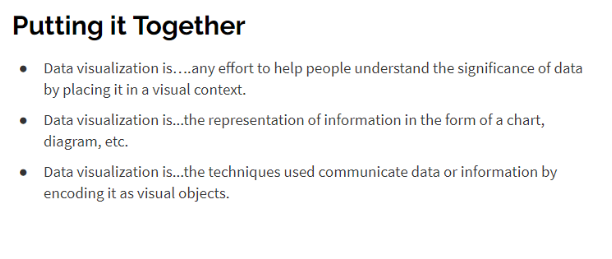
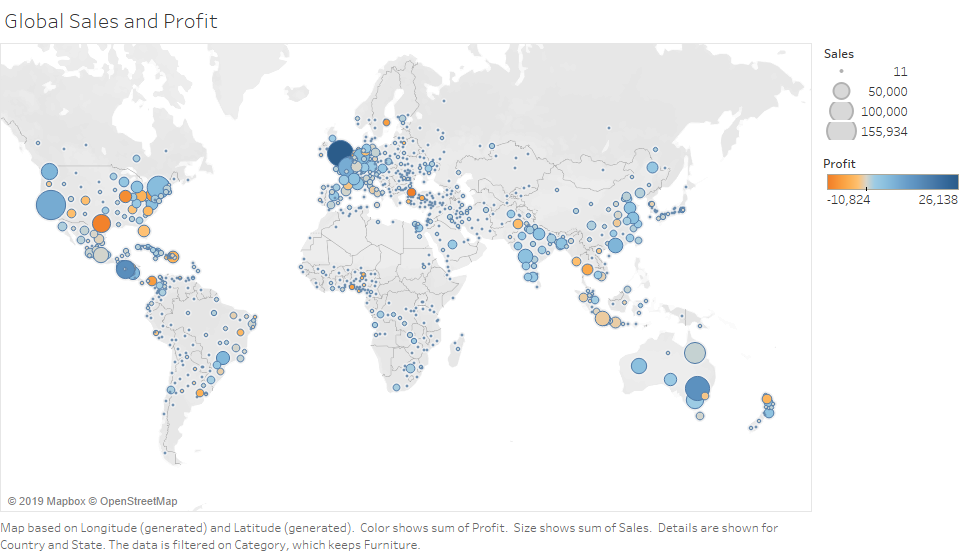
 Of course, with any chart or visualization, there is always an intended purpose and audience in mind. For data visualization, artists can compare between data points, display parts of a whole, help users identify relationships, or even show the distribution of a dataset. What to do, however, depends on the needs of the audience, including what they may not know and what they could potentially get out of a certain visualization. For example, if someone wants to know the types of users that log onto a website, it wouldn’t be productive to create a visualization showing a distribution of total logins throughout the week.
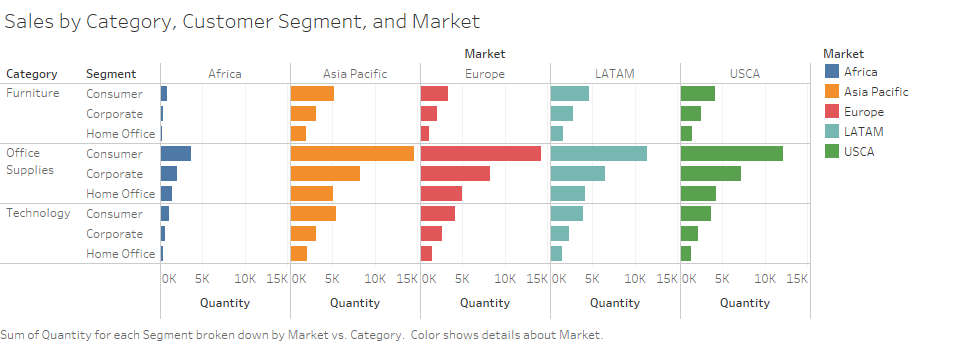
 After the workshop, I approached Rossetti regarding her motivations for returning to UConn, not only as a guest lecturer, but also as an adjunct faculty member. Outside of this Data Visualization workshop, she teaches OPIM 3804: Data Visualization, open to all Management Information Systems (MIS) students and Data Analytics minors. “When I was a student at UConn,” she said. “I wasn’t sure in which direction I wanted to go in. I started as a Management major, finished all of my requirements, and then heard about the certificate in OPIM [the Data Analytics minor]. That led me into the world of analytics, a path I never imagined. Because I had that opportunity as a student, I was exposed to classes that were taught by adjunct faculty. There, I was able to see what they were doing in the real world, and what tools they were using. I knew from the moment I met one of my teachers [adjunct
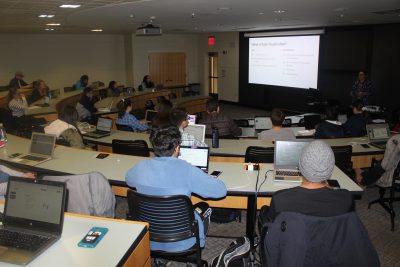
  On Thursday, October 31st, Hanover Insurance and OPIM Innovate co-sponsored a Predictive Analytics workshop. Run by alumni and Travelers Data Integrity Specialist