Author: Mariela Kridzelis

MEM Majors Brainstorm Manufacturing Solutions with AR/VR

On Thursday, November 21st, OPIM Innovate hosted a rotational virtual reality (VR) and augmented reality (AR) workshop for UConn’s Management and Engineering for Manufacturing program (MEM). Here, students from Professor Mousumi Roy’s MEM3221 class were tasked with brainstorming ways in which either VR or AR can be integrated into the manufacturing process. 

In order for OPIM Innovate to accommodate all participating MEM students, the same workshop was given three different times throughout mid-November. Stations were set up around the Innovate Lab to accommodate several people at once, featuring devices such as the Google Cardboard headset and the Oculus Go. The most popular of all virtual reality devices was the HTC Vive. This wired headset allowed students to participate in Valve’s The Lab, an immersive experience with various minigames showcasing the potential of VR. 

After participating in all stations, students became more comfortable with VR and AR technology. This led to the insurgence of ideas for MEM applications and an enthusiasm for innovation. Daniel Castillo (MEM ‘19), for example, informed me that VR would be a great way to start training incoming manufacturing personnel. “It can teach us how to program and utilize on-site machinery,” he said. “Since we don’t all have access to these machines in schools, VR is a great alternative.” 

Two other students, Nick Porebski (MEM ‘20) and Ben Zekowski (MEM ‘20), informed me of their ideas for VR applications in computer-aided design (CAD). “Students could view and interact with a draft of their design in real-time,” Nick said. “And, since you don’t have to print the material,” Ben added, “it could save on time and cut costs.” 

We thank the MEM department for their interest in the OPIM Innovate initiative and to all the students who participated in this event! For any innovation inquiries, please feel free to consult the Lab, again! 
Hanover Image Analytics Challenge Displays the Power of Interdisciplinary Teams

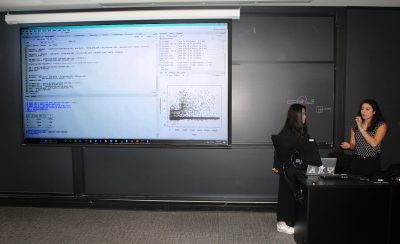
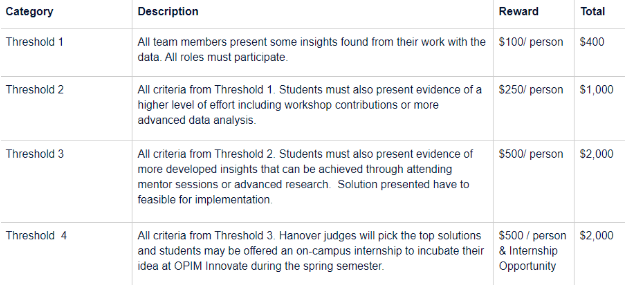
On Wednesday, November 20th, OPIM Innovate hosted the Hanover Image Analytics Challenge in partnership with Hanover Insurance Group. There, ten teams competed for the opportunity to implement their solutions in a real-world business setting through a spring semester externship. Cash prizes were split between four different thresholds, each having their own requirements. While the lowest threshold provided each participant with a baseline of $100, the highest threshold awarded each team member with $500 and an opportunity to work with Hanover. The objective of the challenge was to have participants make use of a dataset including details on current customer properties and prospective properties to be insured by Hanover.
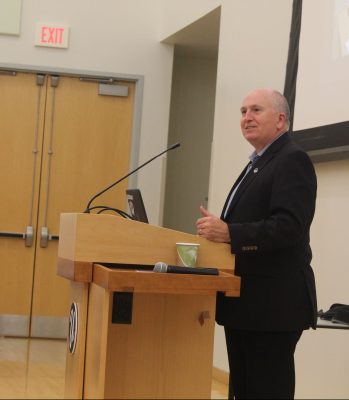
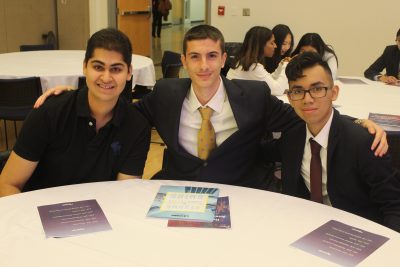
The difference between this challenge and other case competitions is that it implored students to search for interdisciplinary team members. Rather than having all participants be business majors or intra-major, there were a multitude of participants with little to no business or technical knowledge. As explained by Rob Brewer, Middle Market Vice President and Chief Underwriting Officer at Hanover, the required roles self-assigned by each team member–business analyst, marketing specialist, developer, and data analyst–reflected Hanover’s real-world teams. “Our employees seldom work by themselves,” Brewer said. “They’re always working together across roles.” 
Through the Hanover Challenge, students learned the benefits of cross-boundary teaming. Competitors from OP I AM, one of the Threshold 3 teams recognized during the Awards Dinner following the challenge, made this clear during the Q&A portion of their presentation. When asked what was most challenging while working through their solution, which included the use of data science methodologies to detect and assess certain property holdings, Mariela Kridzelis (MIS & English ‘19), the team’s marketing specialist, commented on the benefits of an interdisciplinary team. “I wouldn’t necessarily go down the challenge route,” she said. “I thought working with my team members was extremely enlightening. We all learned something from each other.” 

Vaughn Nangle, the data analyst of another Tier 3 group entitled Alpha Analytics, also commented on team dynamics. “Throughout the Challenge, my team members and I collaborated so well that we thought we were working beyond our roles. By the very end of the Challenge when we finally presented our solution, that’s when we realized we were actually performing our roles the entire time. In working together, we shared skillsets and expanded each other’s knowledge–it just goes to show how beneficial teams like these are.” The solution Alpha Analytics presented to the judges was a variable heat map of various insurance risk factors. 

We’d like to extend a warm thank you to the Hanover Insurance Group and all faculty and staff that helped with the Hanover Image Analytics Challenge. We’d also like to thank the ten remaining teams of the Image Analytics Challenge for presenting their amazing solutions! 

Please scroll through the slide deck below for team photos.


Student Spotlight: Andrew Eastman

Raised in small-town East Granby, CT, Andrew Eastman (MIS ‘20) has always had a passion for technology. In addition to high-school sports and extracurriculars, his grade-school hobbies included building computers and modifying video games with his friends. While working with technology influenced his upbringing, using technology applications to solve business problems or to create unique experiences for others was, and continues to be, his primary motivator. After taking multiple high-school-level business classes and enjoying the experience, he knew he wanted to pursue a degree in business. Touring UConn and learning more about the Management Information Systems (MIS) major during his senior year, he realized the MIS program was a perfect fit for him. “It combined my interests in business and technology,” he said. “And since I graduated in a class of sixty-or-so kids, I was excited about UConn’s size and diversity.”

Once at UConn, Andrew sought after every possible way to pursue his interests and develop his professional skills. He saw every opportunity as a way to improve, learn, and mature into a more complete adult. This led him to join many different business organizations, including the Information Management Association (IMA). He found the IMA to be a great way to meet other technology-oriented students, learn more about the IT field, and network with professionals. He also participated in many case competitions including the PwC Case Competition, the MIS Case Competition, and, more recently, the Hanover Image Analytics Challenge. “I definitely recommend doing case comps,” he said. “They’re fun and you usually get to work on a real-world problem, so it’s a great way to get some experience under your belt.”

During his junior year, Andrew became the treasurer of the IMA. The purpose of IMA, as briefly mentioned above, is to bridge the gap between UConn students and IT opportunities, regardless of their major. “As treasurer, you manage all the financials of the organization, but it’s not only about doing my job. It’s also about meeting new students, professionals and building connections,” he explained. When asked what being part of the IMA e-board taught him, he answered the following: “The role taught me how to coordinate efforts with many different people, organizations, and to work as a team with other E-board members. It also helped me improve my public speaking and presentation skills.” 

This past summer, Andrew interned at MassMutual as an IT business analyst. As part of his role and summer project, he assisted in the development of a large database. His objectives were to convert three of the company’s database systems into one master database. He also had to update the new database from its outdated version. Andrew conveyed the needs of his specific team with help from the functional knowledge he acquired. His work also had many project management elements, including the use of scrum and agile methodologies within the company. 

Now that Andrew is finishing up his last two semesters of college, he feels prepared for life after undergrad. “MIS definitely helped me find out what I wanted to do,” he said. “The fact that there are so many resources provided is huge.” Specific to the Operations and Information Management department, he’d like to shout out Jon Moore: “He’s a great resource. He can help you with anything MIS related, whether it be course selection, general advice, or finding an internship or job.”

For students currently interested in MIS or beginning to pursue the major, Andrew offers this advice: “Definitely get involved with MIS events as soon as possible. The major offers incredible opportunities, and if you take them you’ll definitely have a leg up on the competition. Utilize the resources in the Gladstein Lab [to teach yourself emerging technologies] and participate in IMA functions to hear about potential employment opportunities. Don’t be afraid to step out of your comfort zone. Experience is extremely valuable.”

UCAELI Students Learn Design Thinking During Innovate Workshop

On Thursday, November 14th, OPIM Innovate hosted a Design Thinking workshop in partnership with the UConn American English Language Institute (UCAELI). During this workshop, students participating in the College Preparatory Experience program learned the first three steps of design thinking: define, empathize, and ideate. These steps implore students to define business objectives, understand the needs of their audience, and brainstorm potential ideas for a business solution. Tara Watrous, Innovate’s project coordinator, assisted students throughout the design thinking process by providing an overview of each step. She then provided the following prompt for students to answer in groups: “How can technology be utilized to enhance learning English as a second language?”
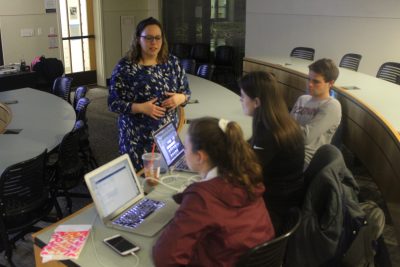
Throughout the group portion of the workshop, participating students were able to work with Innovate Lab specialists for insight. As the prompt allowed for many open-ended ideas, each group had their own unique solution at the culmination of the workshop. Ideas included:

  • a chatbot
  • a virtual reality application where students can immerse themselves in English-speaking environments
  • an application for students of different native languages to communicate and practice other tongues
  • an augmented reality application that quizzes students on their English by displaying images that represent different dictionary words
  • mixed-reality glasses language learners can wear to learn English through environment narration

“The combination of our students’ innovative minds and emerging technology create immense potential for solving problems,” Watrous commented after the event. “Each student group came up with their own unique and creative idea for English-language learning. We hope to see them in our space again to start prototyping!”


OPIM Innovate is Hiring! Student Lab Specialist Positions Available!

OPIM Innovate is currently seeking to fill three new student lab specialist positions for the spring of 2021.

As a student lab specialist, student workers must test and give presentations on the emerging technologies OPIM Innovate has to offer. In addition, lab specialists must assist students with various lab projects. Great communication and customer service skills are a must. Experience with virtual/augmented reality, 3D printing/modeling, IoT/data analytics, drones/wearable tech, A.I./Blockchain is also preferred, but not required.

The communications specialist must have the flexibility to attend events throughout the semester, good interpersonal and writing skills, and a willingness to learn about the emerging technologies the Lab has to offer. In addition, they must be able to work independently; interview students, professionals, and staff; and assist other Lab employees when necessary.

The student lab specialist positions are Class III jobs and offer great internship experience for students interested in learning about up-and-coming technologies. For more information on the student lab specialist position, please click here to be directed to the job listing on UConn JobX.

For any additional questions, please contact OPIM Innovate Director,  Jonathan Moore at jonathan.a.moore@uconn.edu.

We appreciate your interest and are excited to see your applications!

Work with Bennie, an Employee-Benefits Startup

Attention all Management Information Systems majors! Interested in joining a brand-new startup focused on bettering the employee-benefits supply chain for companies? Bennie, based out of New York, is currently looking for a Data Operations Analyst.

As a Data Operations Analyst at Bennie, responsibilities would include cleaning data, creating data templates, implementing data solutions, and using data to drive business value. The employee would work with product teams and internal stakeholders to drive projects forward. Basic requirements include understanding Microsoft Excel and common spreadsheet formulas, but knowledge about the employee-benefits industry, database management, and SQL is preferred.


Interested in this position? Send your resume to Jonathan Moore at jonathan.a.moore@uconn.edu!

Students Develop Data Visualization Skills at Hanover Challenge Workshop

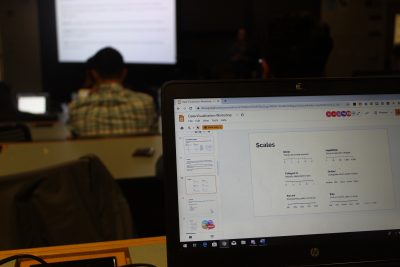
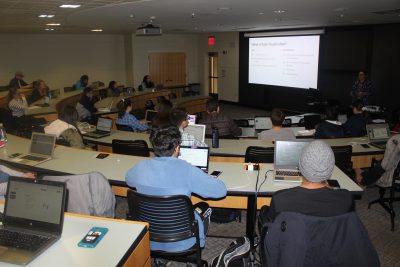
On Thursday, November 7th, Hanover Insurance and OPIM Innovate co-sponsored a Data Visualization workshop. Run by Olivia Rossetti (Management ‘15), Senior Data Integrity Specialist at Travelers and UConn alum, students were introduced to data visualization fundamentals and the Tableau software. 
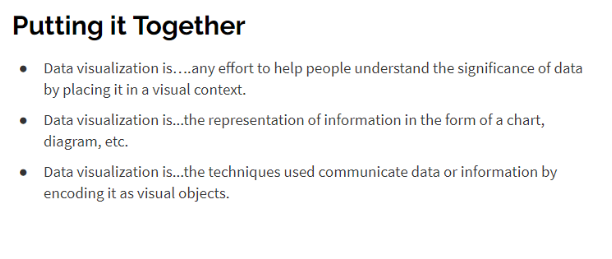
Rossetti’s framework for introducing students to data visualization began with a general overview of the topic. After defining the purposes of both data and visualization separately, she presented students with the three following definitions: 

In order to visualize data, students had to understand the four key components of data visualization: visual cues, the coordinate system, scale, and context. Whereas visual cues use elements such as shape, size, and color to portray certain values, the coordinate system, scale, and context of a visualization assign additional meaning to those values. Take a bar chart, for example. The length of each bar indicates a numeric value, and color can be used to distinguish between categories. Meanwhile, the chart’s coordinate system can help users determine specific values, and any added labeling, annotations, and titles can help users identify the context of the data being shown. 

Of course, with any chart or visualization, there is always an intended purpose and audience in mind. For data visualization, artists can compare between data points, display parts of a whole, help users identify relationships, or even show the distribution of a dataset. What to do, however, depends on the needs of the audience, including what they may not know and what they could potentially get out of a certain visualization. For example, if someone wants to know the types of users that log onto a website, it wouldn’t be productive to create a visualization showing a distribution of total logins throughout the week. 
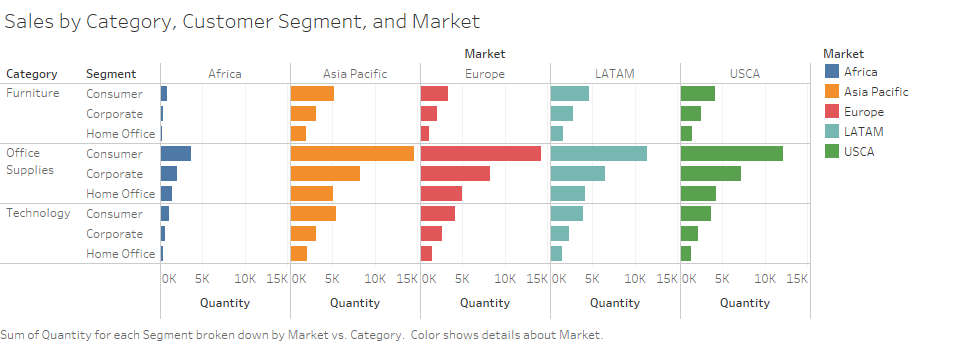
After Rossetti walked attendees through the foundational knowledge needed to understand data visualization, she proceeded with the hands-on component of the workshop–working with Tableau. Everyone gained access to the software through the School of Business virtual machine, and exercises were completed in real-time. One of the many visualizations made consisted of using a provided superstore dataset to display sales by product category, customer segment, and market:

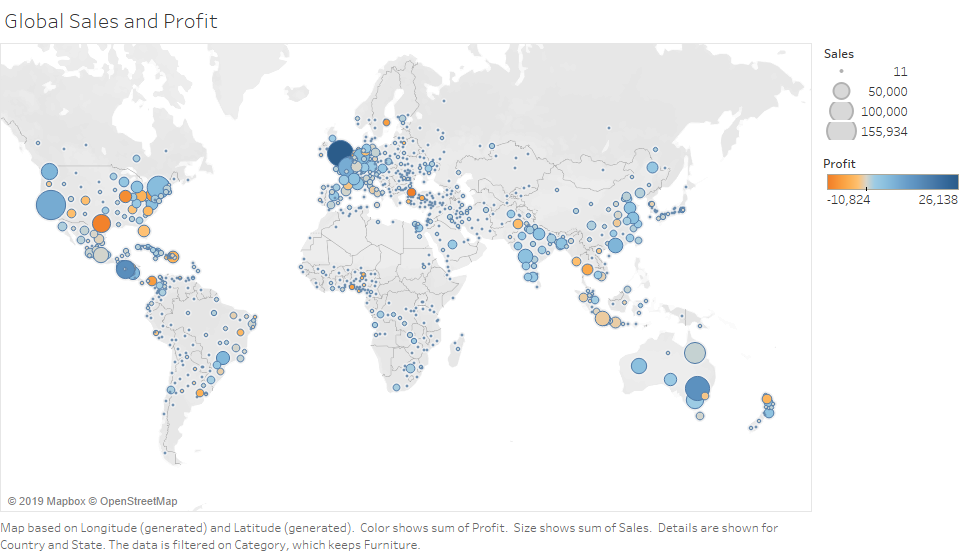
Another, more intuitive visualization, consisted of portraying global sales and profit. Size was used to indicate the degree of success for sales. Color was used to indicate profit at a gain or loss:

After the workshop, I approached Rossetti regarding her motivations for returning to UConn, not only as a guest lecturer, but also as an adjunct faculty member. Outside of this Data Visualization workshop, she teaches OPIM 3804: Data Visualization, open to all Management Information Systems (MIS) students and Data Analytics minors. “When I was a student at UConn,” she said. “I wasn’t sure in which direction I wanted to go in. I started as a Management major, finished all of my requirements, and then heard about the certificate in OPIM [the Data Analytics minor]. That led me into the world of analytics, a path I never imagined. Because I had that opportunity as a student, I was exposed to classes that were taught by adjunct faculty. There, I was able to see what they were doing in the real world, and what tools they were using. I knew from the moment I met one of my teachers [adjunct Marshall Dougherty], that I wanted to provide the same experience down the road–I wanted to make an impact.”
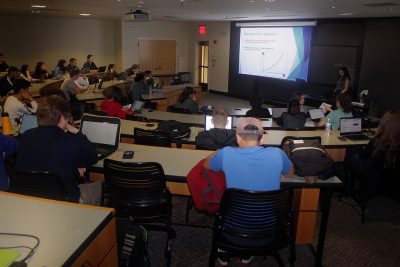
We thank Olivia for her contribution to the Hanover Challenge and to the MIS curriculum. We also extend a warm thank you to everyone who attended the Data Visualization workshop!

Students Introduced to Predictive Analytics During Hanover Workshop

On Thursday, October 31st, Hanover Insurance and OPIM Innovate co-sponsored a Predictive Analytics workshop. Run by alumni and Travelers Data Integrity Specialist Aleya Hafez (Mathematics & Statistics‘18), students were introduced to different data modeling approaches. 

Hafez’s lecture followed the usual data modeling framework–cleaning data with hypotheses in mind, splitting data, and finally creating predictive models. This, of course, came with the need to explain what each segment entailed, information she generously opened with. In explaining the data cleaning process, she informed students of potential outliers, duplicate records, data input errors, or any other abnormal or extraneous data that may skew test results. With regard to splitting the data, she taught students the difference between a training dataset and a test (or validation) dataset. In brief, training datasets and test datasets are samples taken from the whole; training datasets are used to build initial models, whereas test datasets are there to verify results. As for creating models, Hafez specified the process to further increase understanding.

To provide students with a conceptual guide of data modeling, Hafez broke down the process into the following steps:

From these steps, she then explained separate modeling types, such as linear regression, logistic regression, and decision trees. Whereas linear regression predicts specific numeric values, logistic regression and decision trees predict the probability of something being true or not. For example, a model using logistic regression will be able to predict whether an email is spam or not. A decision tree, on the other hand, brings these probabilities into finer and finer levels depending on the number of nodes, or categories, added (see below):

Decision trees may also be used to assess model outcomes against actual data. This helps data scientists select the best models to use. 

To end the lecture, Hafez used the concepts she described to create predictive models in R. This gave students the chance to see data modeling in action, and provided them with enough of a preview to ask clarifying questions. 

When Hafez was asked why she volunteered her time to share her knowledge on predictive analytics with UConn students, she said the following: “I’ve always enjoyed helping other people, and it excites me to know that someone other than me is interested in statistics. It’s great to see that the UConn School of Business is putting more of an emphasis on predictive analytics, so I’m happy to give my take!”

We thank Hafez for her time and everyone who attended the Predictive Analytics workshop!


World Fuel Service is Hiring! 2020 IT Summer Internship Program

Attention all Junior and Senior Management Information Systems students! World Fuel Services is seeking new interns for its 2020 IT Internship Program. A Fortune 100 company and world leader in energy solutions, World Fuel Services helps aviation, marine, commercial, industrial, and land transportation customers across the globe!

Are you interested in business analysis or software development? World Fuel Services is specifically interested in fulfilling these roles, so now is your chance!


World Fuel Services from World Fuel Services Corporation on Vimeo.


For more information on the IT Summer Internship Program, including application requirements, other roles available, and where to apply, please click here.

Lab Specialists Get Students Excited About Tech at Innovation Expo

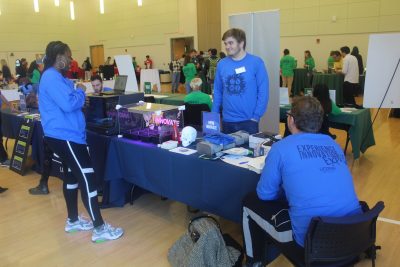
On Monday, October 21st, UConn held its annual Experience Innovation Expo in the Student Union Ballroom. There, OPIM Innovate Lab Specialists Eli Udler (English & CS ’20) and Vaughn Nangle (Physics ’20) introduced students to emerging technologies and agricultural solutions, such as virtual reality (VR) headsets and hydroponics. The VR headsets, especially, were a hit due to the photorealistic graphics of the Oculus Go. Students were immersed in titles such as Jurrasic World VRSE, where they could watch dinosaurs thrive in 3D.
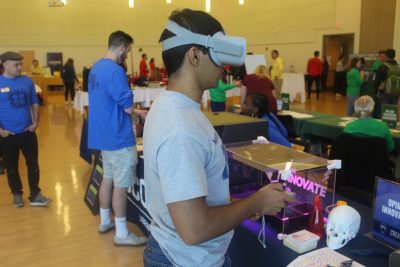
Udler, a wearable technology expert, also networked with the Puppet Arts department during the Innovation Expo. Having experienced working on wearable technology projects before, he believes UConn Puppetry can benefit from technology integrations. This may vary from projects including the Mindwave, a device that can read brain patterns, to Adafruit sensors that can detect sound and movement. “I’m excited to help introduce Innovate to different UConn departments,” said Udler. “Working with puppets will be a fun challenge.”

Both lab specialists had a great time demoing the latest and greatest technologies to those curious enough to stop by. “It was cool to see people so interested in what we do,” Nangle said. “Now I just wonder what they’ll do with our resources.”

We thank everyone who visited our booth during the Experience Innovation Expo and to the Werth Institute for putting this event together!